Sunday, February 05, 2006
Shooting For Average : Index funds in your portfolio
Index funds are well-known for their advantages: low expenses, passive management, and, in most cases, zero loads. Index funds shoot for average performance at low cost. While most index funds in the US track broad indices, such as the S&P500 or the Wilshire 5000, Indian index funds track either the 30-stock Sensex or the 50-stock Nifty. These narrow indices represent the bluest of the Indian blue-chips but are too small to represent the entire market. My argument is that, given these narrow indices, an investor should look at index funds as the replacement of the large-cap part of his or her portfolio.
Lake Wobegon
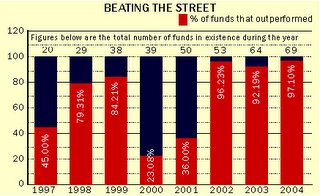
Figure 1 shows the number of funds outperforming the Sensex each year since 1997. If 90% of mutual funds can outperform the Sensex for three years running, the Sensex is not the average. Either that, or we have the change the definition of average.
Figure 1: >90% MFs beat the Sensex in 2002-2004
Looking at the best-performing mutual funds for the trailing year shown in Table 1, we can see that the average large-cap holding of the mutual funds is 38.20% and that the average capitalization of the companies in the portfolio is ~Rs.5000Cr. Compare this with the average capitalization of the index stocks of Rs30,000Cr (Sensex) and Rs.27,000Cr (Nifty). The average capitalization of the companies that these funds invest in is less than 1/5th of that of the index stocks.
FUND NAME | Average Market Cap (Rs.Cr) | % in Large Caps (2005) | 1-year returns(trailing) |
Sensex | ~33000 | 100.00% | 47.17 |
Nifty | ~27000 | 100.00% | 41.41 |
1249.28 | 8.00% | 80.21 | |
1219.11 | 5.00% | 86.78 | |
5088.72 | 50.00% | 83.24 | |
856.07 | 0.00% | 83.15 | |
5293.63 | 55.00% | 78.88 | |
3210.94 | 34.00% | 73.97 | |
7156.14 | 56.00% | 73.61 | |
7552.52 | 57.00% | 72.63 | |
5631.47 | 47.00% | 72.23 | |
14059.88 | 70.00% | 71.41 | |
Average | 5131.78 | 38.20% | 77.61 |
Table 1: Best performing funds (1-year trailing)
But what about active mutual funds that are fishing in the same pond as these indices? It would seem logical that, with the weight of professional management behind them, mutual funds investing in large-cap companies would outperform the indices. Table 2 shows the performance of mutual funds with the highest proportion of large caps in their portfolio.
| FUND NAME | Average Market Cap (Rs.Cr) | % in Large Caps (2005) | 1-year returns (trailing) |
| Sensex | ~33000 | 100.00% | 47.17 |
| Nifty | ~27000 | 100.00% | 41.41 |
| UTI Index Select Equity | 44817.79 | 95.00% | 42.43 |
| ING Vysya Nifty Plus | 40848.18 | 99.00% | 36.26 |
| Can D'Mat | 34529.66 | 100.00% | 62.51 |
| HDFC Index Sensex Plus | 32157.91 | 94.00% | 48.68 |
| LICMF Sensex Advantage | 31037.17 | 94.00% | 43.91 |
| UTI Large Cap | 27345.49 | 93.00% | 35.4 |
| DSPML Top 100 Equity | 27339.49 | 96.00% | 52.11 |
| UTI PSU | 24023.05 | 85.00% | 31.5 |
| BirlaSun Life Frontline Equity | 22355.76 | 79.00% | 49.12 |
| Cangrowth Plus | 21769.13 | 84.00% | 59.6 |
| Average | 30622.36 | 91.90% | 46.15 |
Table 2: Large-cap mutual funds (1-year trailing)
Using an index fund
If an investor just chooses the funds with the best past returns, he or she will be overweight on small-cap and mid-caps stocks. An approach that could work is to take care of the large-cap representation with an index fund first. This leaves the investor free to choose a basket of funds that invest exclusively in small-caps and mid-caps to top off the portfolio.

